PROBER
Tutorial
Section 5
PROBER: Output the primer and probe sequence files
After
probe selection is complete a similar layout of the probes will appear
in the main window
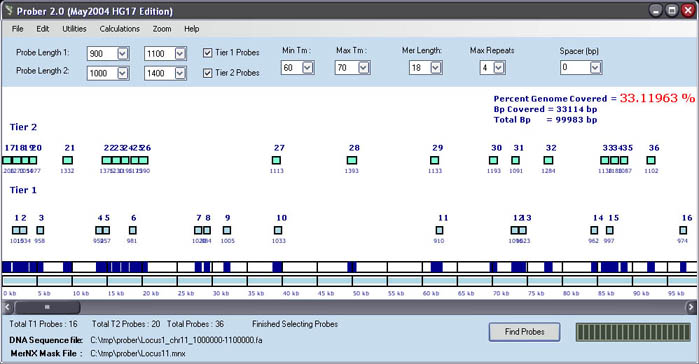
The
probe layout shows that PROBER found 16 Probes from 'Tier 1'
of probe selection and 20 Probes in 'Tier 2'. The distribution of the
probes across the genomic region can be visualized along with the total
coverage in dark blue at the bottom of the screen. The light blue indicates
the total genomic region that was considered for probe design (in our
case a 100kb region). Above each rectangle (probe) is the probe identifier
(Probe ID) and below is the probe length.
The Percent Genome Covered (PGC) will read 0.0% until it is calculated.
To calculate the PGC go to Calculations > Percent Genome Coverage
The window will update to 33.11936 % for the PGC, which indicates sufficient
coverage of this locus for FISH.
In addition the total base pairs covered will update to 33,114bp
and the total base pairs will display 99,983bp.
Note : In general, if the PGC is < 20% or less
then 20 probes are identified, we recommend using more relaxed parameters.
To do so increase the range between probe size in both the Tier1 and Tier2
probe lengths. Increasing the range between the minimum and
maximum Tm's will also increase the number of probes the algorithm can
identify. Once the new parameters are set, just press the 'Find Probes'
button again and repeat this process until enough probes are identified
(we recommend finding at least 20 probes for PCR amplification).
Note : If no probes are identified by relaxing the
parameters, then return to the MerMatch & Tolerance program and run
the MerMatch algorithm again with the "mer.count.cutoff"
set higher by (+1).
The user can also use the zoom menu bar to zoom in to 50% or 200% to get
a better look at the probe numbers and their position on the locus.
To save an image of the probe layout in *.jpg format, go to File >
Save Image File
To save the FULL REPORT go to File > Save *.probes
file > Save Full Probe Report
This report contains the probe identifier (Probe ID), the primer sequences,
primer lengths, primer locations (relative to the 1st base pair of the
genomic sequence), Primer melting temperatures (Tms), the probe length
and the probe DNA sequence. Each probe will appear in the file as follows
:
::::::::::::::::::::::::::::::::::::::::::::::::::::::::::::::::::::::::::::::::
-TIER-1-PROBES:::::::[FULL PROBE REPORT]::::::::::::::::::::::::::::::
::::::::::::::::::::::::::::::::::::::::::::::::::::::::::::::::::::::::::::::::
Probe ID 1
PrimerFseq :GCCATTGGCCGCATGCCATGTG
PrimerRseq :TCCAGTTGATCCTACCACAGATGG
PrimerFseq Unmasked :GCCATTGGCCGCATGCCATGTG
PrimerRseq Unmasked :CCATCTGTGGTAGGATCAACTGGA
PrimerF_length :22
PrimerR_length :24
PrimerF_loc :1522
PrimerR_loc :2549
PrimerF_tm :72
PrimerR_tm :72
Probe Length : 1051
Probe Sequence :
GCCATTGGCCGCATGCCATGTGCCACCTGCGGCTTGTGTCTCACCTGTCATCTGGA
CTCAGCACCCAGGCTGCACGTCTGACACCTGAGAGGCGAGAGAGTGGGGCCGGCCT
AGGAGCCAAGGCTGGGGCCTTGCGCTCTGTCCCCAGGATGGTGGCCTTGTTTGTCC
TAAACACACCCAGCACAGGTTCTGGCTTCCTGACATGCTGTGGAGGCAGGGAGGGT
GGGTGGCCACATGTGCTTGAGGGTTTTCACCCTGGCCCTCAGTTGCCTGCTGTGCG
GGTCCCTGGGGCAGCTGCAGGGGCTCATGGACCCATCAGGGTCTCCACAGCTCCCC
TGCAGTGTGTGCACCCCACAATGTCTGCGGCTCTTCTTCCGGCGTGTCGGGCTTTG
ATCACAGCATAGCCACGTCAGTGGCGTGCGCCTCTCGCACAGGCCATTCTGGGTCT
GGTGGTGCCAGGTGCCGTGACACGCCGTGCTGGGCTTGTGCTGCAGCTGGGTGGTG
TGGCCCTCATTCTCATGTTCCAGCTGCTGGGCAGTGCTCTGCCTGTGTGCTGCGCC
TGCAGGCTGCGTGTGCTGCCGTGGATCTCCTGCATCCCTTGACCCCTCCCGCCATC
AGAGGAAAGGCTGCTCCCCGAGGCACCGCTTCCCTGTGCGGCGCTGCAGAGGGGCC
CTCAGTGTGGCACTCCTCGTCAAAGAAAAATAAAGGCTAGAACTGCACCCCGGATC
ACGCGCTTTCTTTGGGGGGAAAGCATCCCATGTAACCCTCATAGCTCCCCGGGGGT
CGCGTGAGGCACAGACCCCAAGGTCCCCGACCTGTCCTTCAGCAGTGGGCTCACGG
GCAGCGGGCATCAGAAAGTGACCTGCCCTTTGCTCCGCCGGTTTGATTCTGGGTGT
GTGGTGGAGCTTTTTGGGACTCAGGTCATGCGGGAACCCCTCCAGCCTGGCCGCAG
GGCTCCCCACTGTACAGTGTGTTGAGGTGCAGCCCAGGGCTCCTTCCTGGGGAACG
GGAGGCCCCGTGGGGATCCTCCAGTTGATCCTACCACAGATGG
Now
save the
SHORT REPORTs for both the FORWARD PRIMERS and the REVERSE PRIMERS
These text files are ideal for ordering the primers from an oligo synthesis
company.
Note : The 'F Primer Short Report' contains the primer sequences for the
forward primers
The 'R Primer Short
Report' contains the REVERSE COMPLEMENT sequence for the reverse primers.
First go to File > Save *.probes file > Save
F Primers Short Report, then
go
to File > Save *.probes
file > Save F Primers Short Report
The short report contains only the primer ID with the Tier and the primer
sequence. This is ideal for ordering primer plates or individual primers
directly from oligo synthesis companies.
::::::::::::::::::::::::::::::::::::::::::::::::::::::::::::::::::::::::::::::::
:::TIER-1 PROBES:::::::::[SHORT FULL F-PRIMER REPORT]:::::::::::::::
::::::::::::::::::::::::::::::::::::::::::::::::::::::::::::::::::::::::::::::::
Primer1_F[T1] GCCATTGGCCGCATGCCATGTG
Primer2_F[T1] AGTTGATCCTACCACAGATGG
Primer3_F[T1] GCTTGCAGCAACGAGCTGCC
Primer4_F[T1] GGTGACGGCCGTGGTTGGTC
Primer5_F[T1] ACCTGGCACCTTCGATGTTG
Primer6_F[T1] CTCAGTTCTTACTGCGCCGCG
Primer7_F[T1] CCAGCGCTGCTGTACGTACCC
Primer8_F[T1] GTCTCACGCTCCAGAGCGG
Primer9_F[T1] GCAGGTGCCGTGGAAGCGGTAG
Primer10_F[T1] GCCGCACTCCTGGTACACCTGG
Congratulations,
the PROBER tutorial is now complete - you have completed the
probe design for your FISH probes and are now ready to determine the copy
number of your locus in cells.
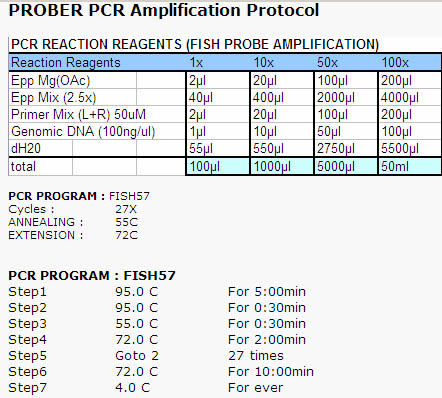
We recommend the following PCR protocol for amplifying FISH probes designed
with PROBER. You may need to adjust the PCR conditions depending
on the parameters that were used for probe selection.
After amplification, the probes can be purified using Qiagen purification
columns or phenol/chloroform, however we highly recommend the former.