APPLICATIONS
Analysis of Recurrent Genomic Amplifications in Breast Tumors
Nicholas
Navin, Jim Hicks, Evan Leibu, Vladimir Grubor, Michael Riggs, Jennifer
Troge, Susanne Maner, Par Lundin, Anders Zetterberg and Michael
Wigler
In
order to determine the amplitude of signal and specificity of the probes
created with PROBER, we tiled 18 genomic regions that were identified
by Representational Oligonucleotide Microarray Analysis (ROMA) in an ongoing
study of breast tumors. For each locus, a mixture of 20-40 amplified TOPs
were labeled with a single (desperate) fluorophore.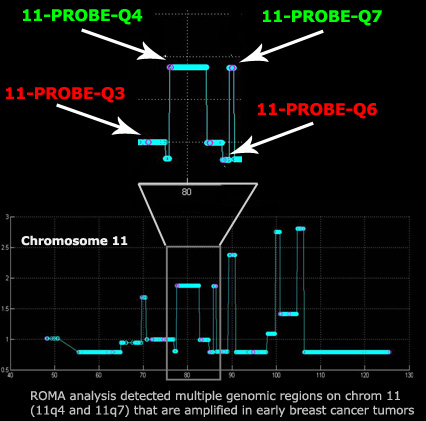 Probes were generated to target specific 50-100kb regions of chromosome
11 that were identified as being recurrently
amplified
in breast cancer tumor cells. Here we discuss the results of two
probes that were designed to target specific amplifications (11-PROBE-Q4
and 11-PROBE-Q7) and two control probes that
were designed to target hemizygous and diploid regions of chromosome 11
(11-PROBE-Q3 and 11-PROBE-Q6)
by FISH.
Probes were generated to target specific 50-100kb regions of chromosome
11 that were identified as being recurrently
amplified
in breast cancer tumor cells. Here we discuss the results of two
probes that were designed to target specific amplifications (11-PROBE-Q4
and 11-PROBE-Q7) and two control probes that
were designed to target hemizygous and diploid regions of chromosome 11
(11-PROBE-Q3 and 11-PROBE-Q6)
by FISH.
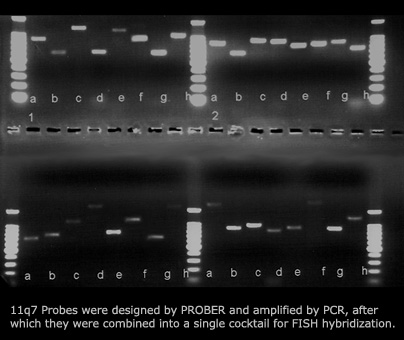
For
each FISH probe 20-40 TOPs were amplified by PCR from a genomic DNA template.
The probes amplified with a high success rate (81.89% mean - circa 32/40
probes) suggesting that the algorithm and parameters for selecting probes
by PROBER were sufficiently stringent. Moreover, only a single
PCR product was observed for each PCR reactions, indicating that the primer
selection algorithm identified unique primers that were specific in amplifying
only a single target sequence.
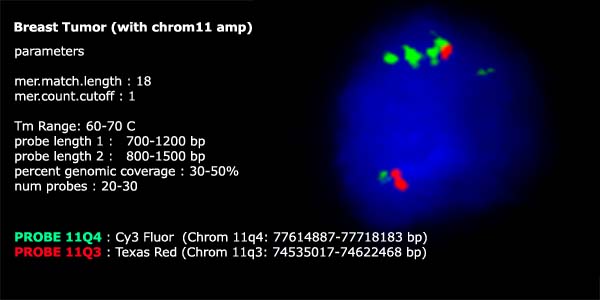
In
each FISH preparation a locus specific probe cocktail was prepared by
mixing the PCR probes together and labelling each mixture with a distinct
fluorophore. In this experiment the mixture of 11-PROBE-Q4
TOPs were labelled with Cy3 and the control probe at 11-PROBE-Q3
was labelled with Texas Red.
Two probes were used for co-hybridization to nuclei immobilized on a slide.
The
copy number quantified by ROMA showed a high correlation (R
= 0.9814)with
the mean copy number actually observed in each tumor sample by interphase
FISH . Furthermore the FISH analysis provided distinct, round spots for
each locus with a high signal:background ratio, as measured by Zeiss Axiovision
software in 25-40 focal planes using a Zeiss fluorescent microscope.
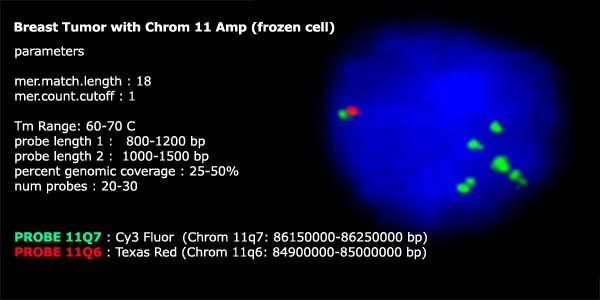
Frozen
breast cancer tumor cells from biopsies were cohybridized with TOP probes
for either 11-PROBE-Q3+11-PROBE-Q4
or for 11-PROBE-Q7+11-PROBE-Q6.
Breast cancer tumor cells that were detected by ROMA to have a copy number
of 1 (hemizygous) for the 11Q6 probe, also showed a single fluorescent
probe by FISH when labeled with Texas red. Tumor cells that were detected
by ROMA to have a 100kb region of chromosome 11 amplified to 4 copies
showed 4 copies when hybridized with the 11-PROBE-Q7 FISH probe. Furthermore,
the FISH probes reveal that the amplification is occuring mainly on a
single chromosome, and not on the other. The other chromosome shows
only a single fluorescent signal for both the control probe (11-PROBE-Q6)
and the probe that was designed to target the amplicon (11-PROBE-Q7).
The tumor cells were stained with DAPI (blue) to determine the boundary
of the nucleus. The copy number of each genomic region was determined
by analyzing the mean copy number of 25-40 focal plane slices of single
cell. Finally the mean copy number for the tumor sample was determined
by observing multiple (10-20) cells within the tumor sample.
The breast tumor cells that were hybridized with a control probe (11-PROBE-Q3)
to target a region of chromosome 11 that was identified as having diploid
copy number by ROMA also showed 2 copies when hybridized with PROBER
FISH probes. The FISH probe that targeted an amplicon
on chromosome 11-PROBE-Q4, that was determined
to have 4 copies by ROMA also showed 4 fluorescent signals by FISH analysis
in a collection of frozen breast tumor cells. The amplification at 11Q4
was observed to occur primarily on one chromosome and not the other by
FISH. Furthermore, the 11-PROBE-Q4
amplification appears to have many smaller fragmented regions that were
not amplified in discreet copy numbers.
In
conclusion, Tiling Oligonucleotide Probes (TOPs) that are designed with
PROBER can reveal precise genomic copy number amplifications
and deletions that occur in frozen tumor cells. Hydridizing
specific probes that target 50-100kb regions in breast cancer not only
provides very accurate information about copy number, but also provides
information on the spatial distribution and chromosomal localization of
amplifications. Additionally, FISH analysis using TOPs can determine if
an amplification as small as a single gene is homogenous or heterogenous
in a tumor cell population.
Table
1 - Correlation of ROMA copy number and PROBER FISH probe copy
number
| Probe | Target Genomic Region | Mean ROMA Copy Number | Mean FISH Probe Copy Number |
| 11-PROBE-P1 | chr11:48100000-48150000 | 2 |
2 |
| 11-PROBE-P2 | chr11:49100000-49200000 | 2 |
2 |
| 11-PROBE-Q1 | chr11:63000000-63050000 | 1 |
1 |
| 11-PROBE-Q2 | chr11:69659081-69753184 | 3 |
3 |
| 11-PROBE-Q3 | chr11:71985480-72068200 | 2 |
2 |
| 11-PROBE-Q3a | chr11:74535017-74622468 | 2 |
2 |
| 11-PROBE-Q4 | chr11:77614887-77718183 | 4 |
4 |
| 11-PROBE-Q5 | chr11:83070000-83170000 | 2 |
2 |
| 11-PROBE-Q6 | chr11:83070000-83170000 | 1 |
1 |
| 11-PROBE-Q7 | chr11:84900000-85000000 | 4 |
4 |
| 11-PROBE-Q8 | chr11:88200000-88300000 | 1 |
1 |
| 11-PROBE-Q9 | chr11:90050000-90150000 | 5 |
5 |
| 11-PROBE-Q10 | chr11:90550000-90650000 | 1 |
na |
| 11-PROBE-Q11 | chr11:99900000-100000000 | 6 |
6 |
| 11-PROBE-Q12 | chr11:100950000-101050000 | 3 |
2 |
| 11-PROBE-Q13 | chr11:102830000-102930000 | 3 |
2 |
| 11-PROBE-Q14 | chr11:105820000-105920000 | 6 |
6 |
| 11-PROBE-Q15 | chr11:125520000-125620000 | 1 |
1 |
Pearson Correlation Coefficient (PCC) = 0.981483745
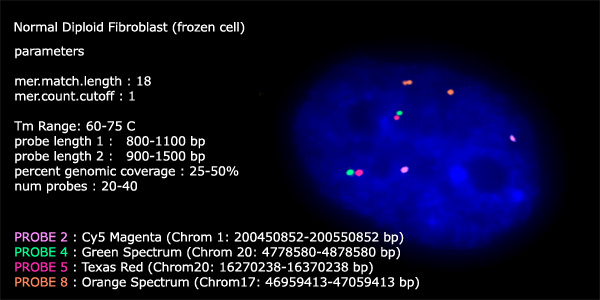
Below
is normal diploid fibroblast cell that was hybridized with control FISH
probes to illustrate normal diploid copy number in contrast to the amplifications
that were observed in the 11Q3a and 11Q7 probes.